Recently, the blog wichitaliberty.org featured a series of graphs intended to rebuke Kansas “liberals'” dissatisfaction with school funding under Brownback. The graphs featured in this post from Wichita Liberty seem to show a sharp increase in the number of teachers with a slower rate of growth in certified employees. What isn’t immediately clear though is the way the graph manipulates the data in question. While the numbers are true, the way the graphs are set up may create a misconception about the data. At first glance the graph appears out of step with what many Kansans are experiencing. Let’s start by looking at the data:
| Academic Year | ||||||
| 2008-09 | 2009-10 | 2010-11 | 2011-12 | 2012-13 | ||
| Certified Employees | 42,537.5 | 42,065.7 | 41,248.3 | 40,970.5 | 41,422.4 | |
| PK-12 Teachers | 31,020.6 | 30,584.8 | 29,975.3 | 30,119.7 | 30,406.5 | |
Source: http://www.ksde.org/Default.aspx?tabid=1870
Looking at this data, the first thing to note is that staffing levels are still down from what they were in 2008-09. There is no denying that staffing has not recovered to pre-recession levels though we have more students and higher needs than we did in 2008. Next, one clearly sees that the lowest year for “PK-12 Teachers” is the 2010-11 academic year. The lowest number for “Certified Employees” is 2011-2012. Based on what is here, let’s start with a graph most of us understand. If we highlight the data in our spreadsheet and then select a line chart, here is what you get:
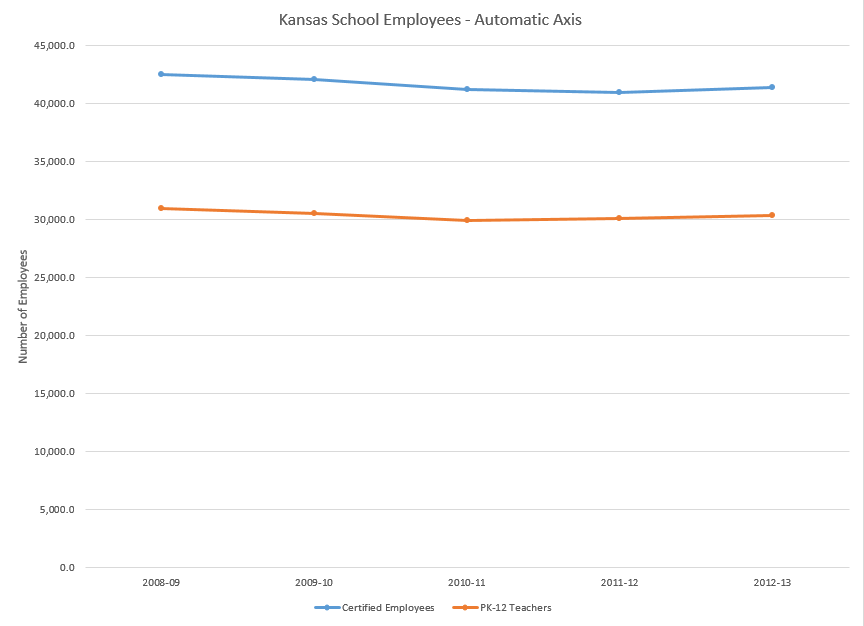
Automatic Axis scaling from spreadsheet (Click for full sized)
While that does seem to show that there are more certified employees (which includes directors/supervisors of health, school counselors, clinical/school psychologists, nurses, speech pathologists, audiologists, social work services, directors/supervisors of special ed, directors/supervisors of vocational ed, instructional coordinators/supervisors, other curriculum specialists, library media specialists, superintendents, associate/assistant superintendents, administrative assistants, principals, and assistant principals) than teachers, that doesn’t seem to paint a very exciting picture. (Full Disclosure: our spreadsheet program thought the appropriate horizontal axis had a minimum of 0 and a maximum of 45,000.) The net change when examined at scale isn’t dramatic. (It should also be noted that the state counts special education teachers in a separate category so you can add figure that there are around 3,900 of them in the number.) Since that doesn’t serve the narrative wichitaliberty.org wants to paint, they changed a few things with the graph. Let’s start by condensing the horizontal axis a bit:
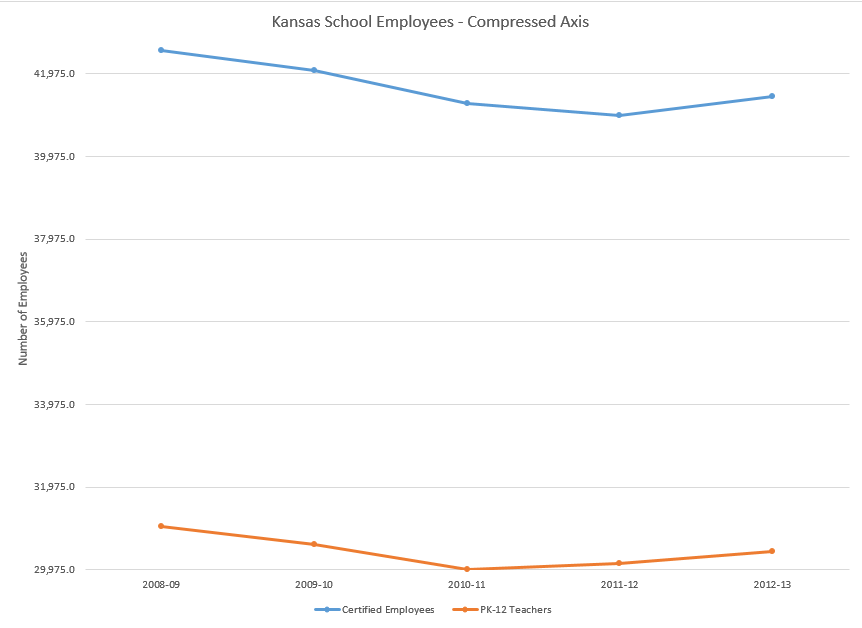
Compressed Horizontal Axis (Click for Full Sized)
Hmm, this graph still not very interesting. (Full Disclosure: we condensed the axis for this graph so that the minimum is 29,975 and the maximum 42,600.) It still doesn’t show a dramatic increase in the number of teachers coinciding with Governor Brownback’s election. Then in what can only be described as a baffling move, wichitalibery.org decides to treat “Certified Employees” like they are completely different kind of unit than “PK-12 Teachers.” Generally, one would only add a second horizontal axis when comparing two different kinds of items. For example if one compared spending to number of employees or employees to teacher student ratio. Look at what that does to the graph:
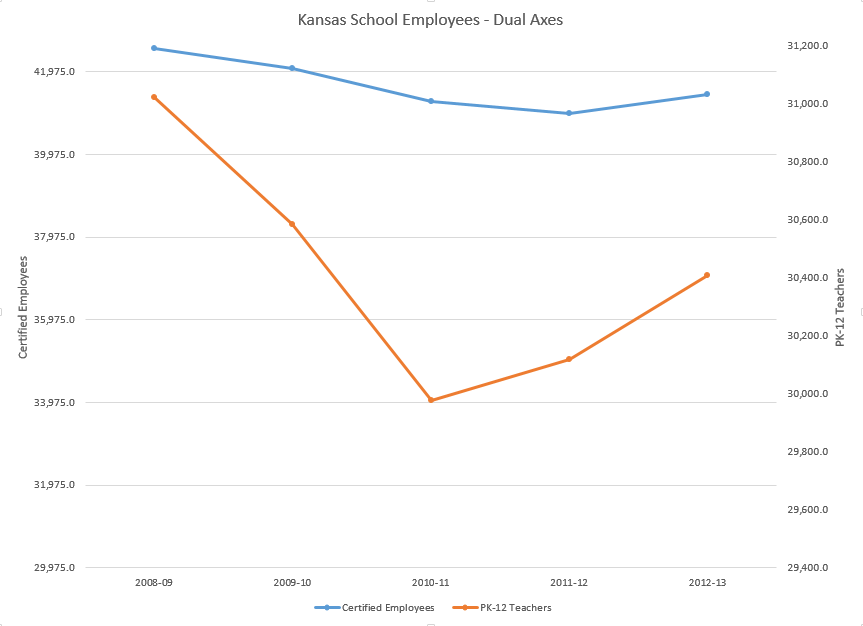
Dual Horizontal Axes (Click for Full Sized)
Still, while this graph is much more exciting as it makes the number of teachers being added seem pretty large, there is the annoying line above it that seems to be pretty boring and seems to distract from the now much more dramatic line for PK-12 Teachers. Now all we need to do is compress the axis again and voilà:
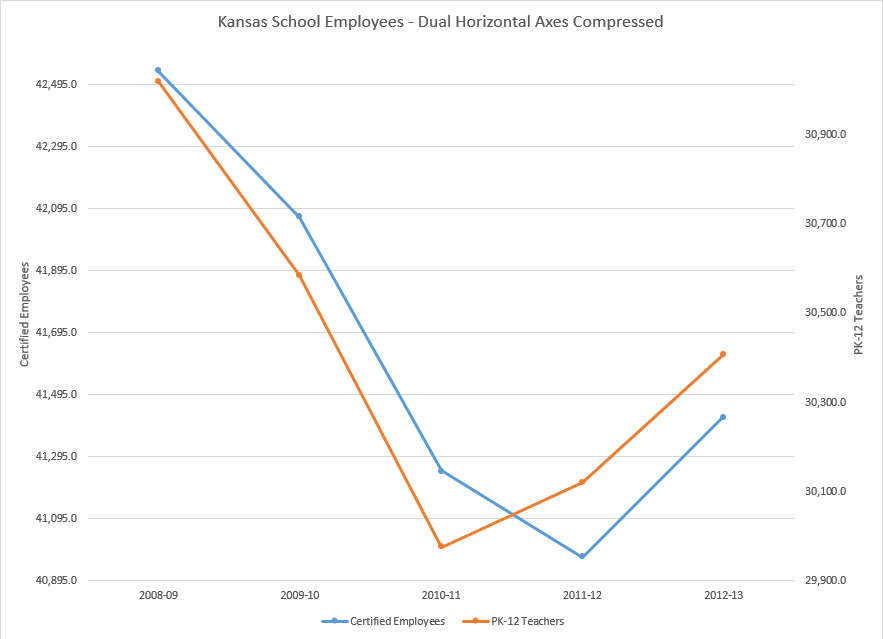
Dual Horizontal Axes Compressed (Click for Full Sized)
Here we see the graph that closely resembles the one presented as a simple illustration of the facts taken from the Kansas Department of Education. (Full Disclosure: The axes are now defined by the following values: Certified Employees, minimum 40,895 and maximum 42,612, PK-12 Teachers minimum 29,900 maximum 31,095.) One might be forgiven for interpreting this chart as if under Brownback the number of teachers now exceeds the number of Certified Employees in Kansas.
At the end of the day, the conclusion “Brownback hasn’t slashed schools” isn’t supported by the data. Employee headcounts could be impacted by a number of factors. Further if one looks at other factors (for example teacher to student ratio, total enrollment, etc.) one may find an alternative explanation for the data one sees. The time for simplistic manipulation of the data to fit a partisan agenda is over. What is needed is more parents, teachers and concerned members of the public to get involved, dig deep and really ask the questions we need to ask to make sure each child in Kansas gets the very best education the state can offer.